Smart lighting
Control the brightness of your connected street lighting with scenarios, monitor its consumption and anticipate failures.
Real-time street lighting consumption monitoring
- 01Total consumptionkWh
- 02Consumption per phasekWh
- 03Cos φratio
- 04Total harmonic distortion THD%
- 05Power quality index%
- 06Voltage (predictive maintenance)V
- 07Light level thresholdslux
- 08Outdoor light level for controllux
Full visibility on your lighting network
Scenario-based control
Brightness is controlled by time-based scenarios, by periods, or directly based on the outdoor light level measured on site.
Remote control
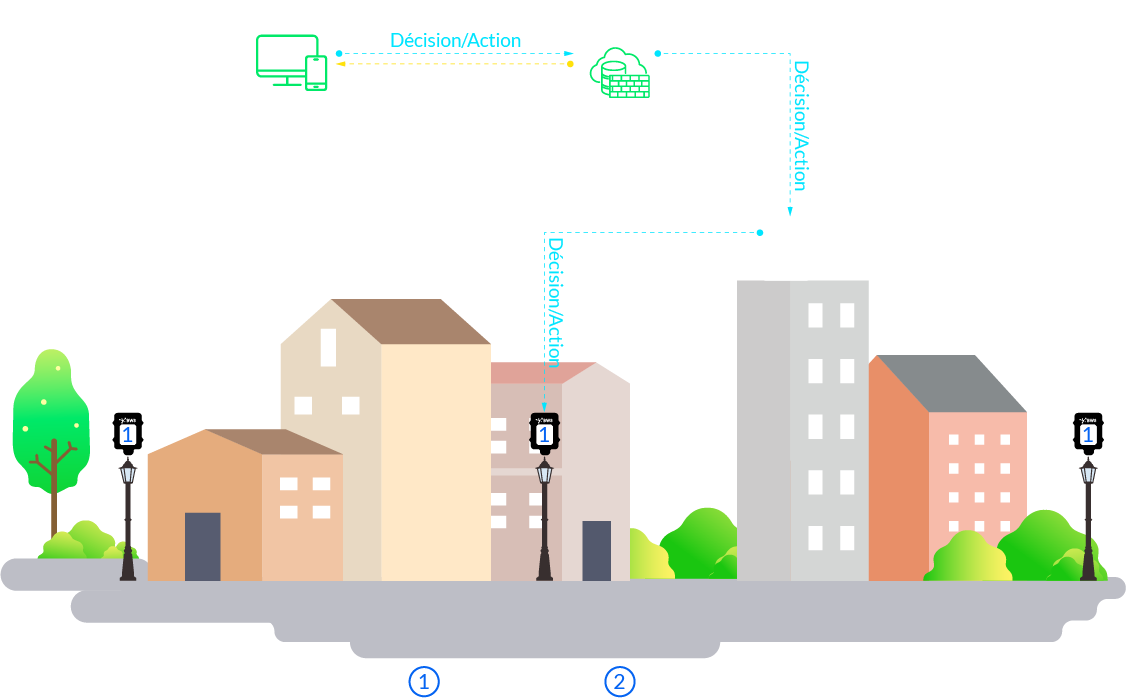
Each lighting device can be controlled remotely, automatically or manually, with no field intervention.
Predictive lighting maintenance
Continuous voltage monitoring helps anticipate failures, with an instant alert as soon as an anomaly is detected on a light fixture.
Monitoring & analysis
An energy history in curves and bar charts, the list of equipment and alerts, and a multi-site comparison tool give a complete view of your network.
Costs & carbon
A bill simulation based on your local tariffs is combined with Eco-IA Dash carbon tracking to measure the reduction in your lighting network's carbon footprint.
Installation mapping
Each light fixture is geolocated on an interactive map with its real-time status (on, off, faulty) and its maintenance history. Maintenance teams immediately locate the point to address and plan their rounds.
The benefits for your teams
Measurable lighting energy savings
Scenario-based control and remote management reduce consumption without compromising lighting quality.
Continuous lighting optimization
The multi-site comparison tool and energy history let you adjust control scenarios to the actual use of each zone.
Fewer failures, fewer emergency interventions
Predictive lighting maintenance anticipates failures before they plunge an area into darkness, for planned rather than reactive interventions.
Smaller carbon footprint
Every kilowatt-hour saved on connected street lighting is included in Eco-IA Dash carbon tracking.
Full visibility across your installations
The list of equipment and alerts gives teams a clear overview, rather than occasional, scattered reports.
Who is it for?
Let's talk about your lighting network
Our experts show you how to reduce the consumption of your lighting network.